Inventory – Number of Sales
Just like in 2020, it seemed like “low inventory” was all we heard in 2021. But like 2020, it wasn’t that low, demand was just through the roof! 349 properties were sold in the 78732 zip code in 2021, vs. 378 in 2020 and 307 in 2019. So, there was an 8% decrease in number of sales over 2020, but 2020 was actually 23% higher than 2019. All in all, there was a 13% increase in number of sales from 2019 to 2021.
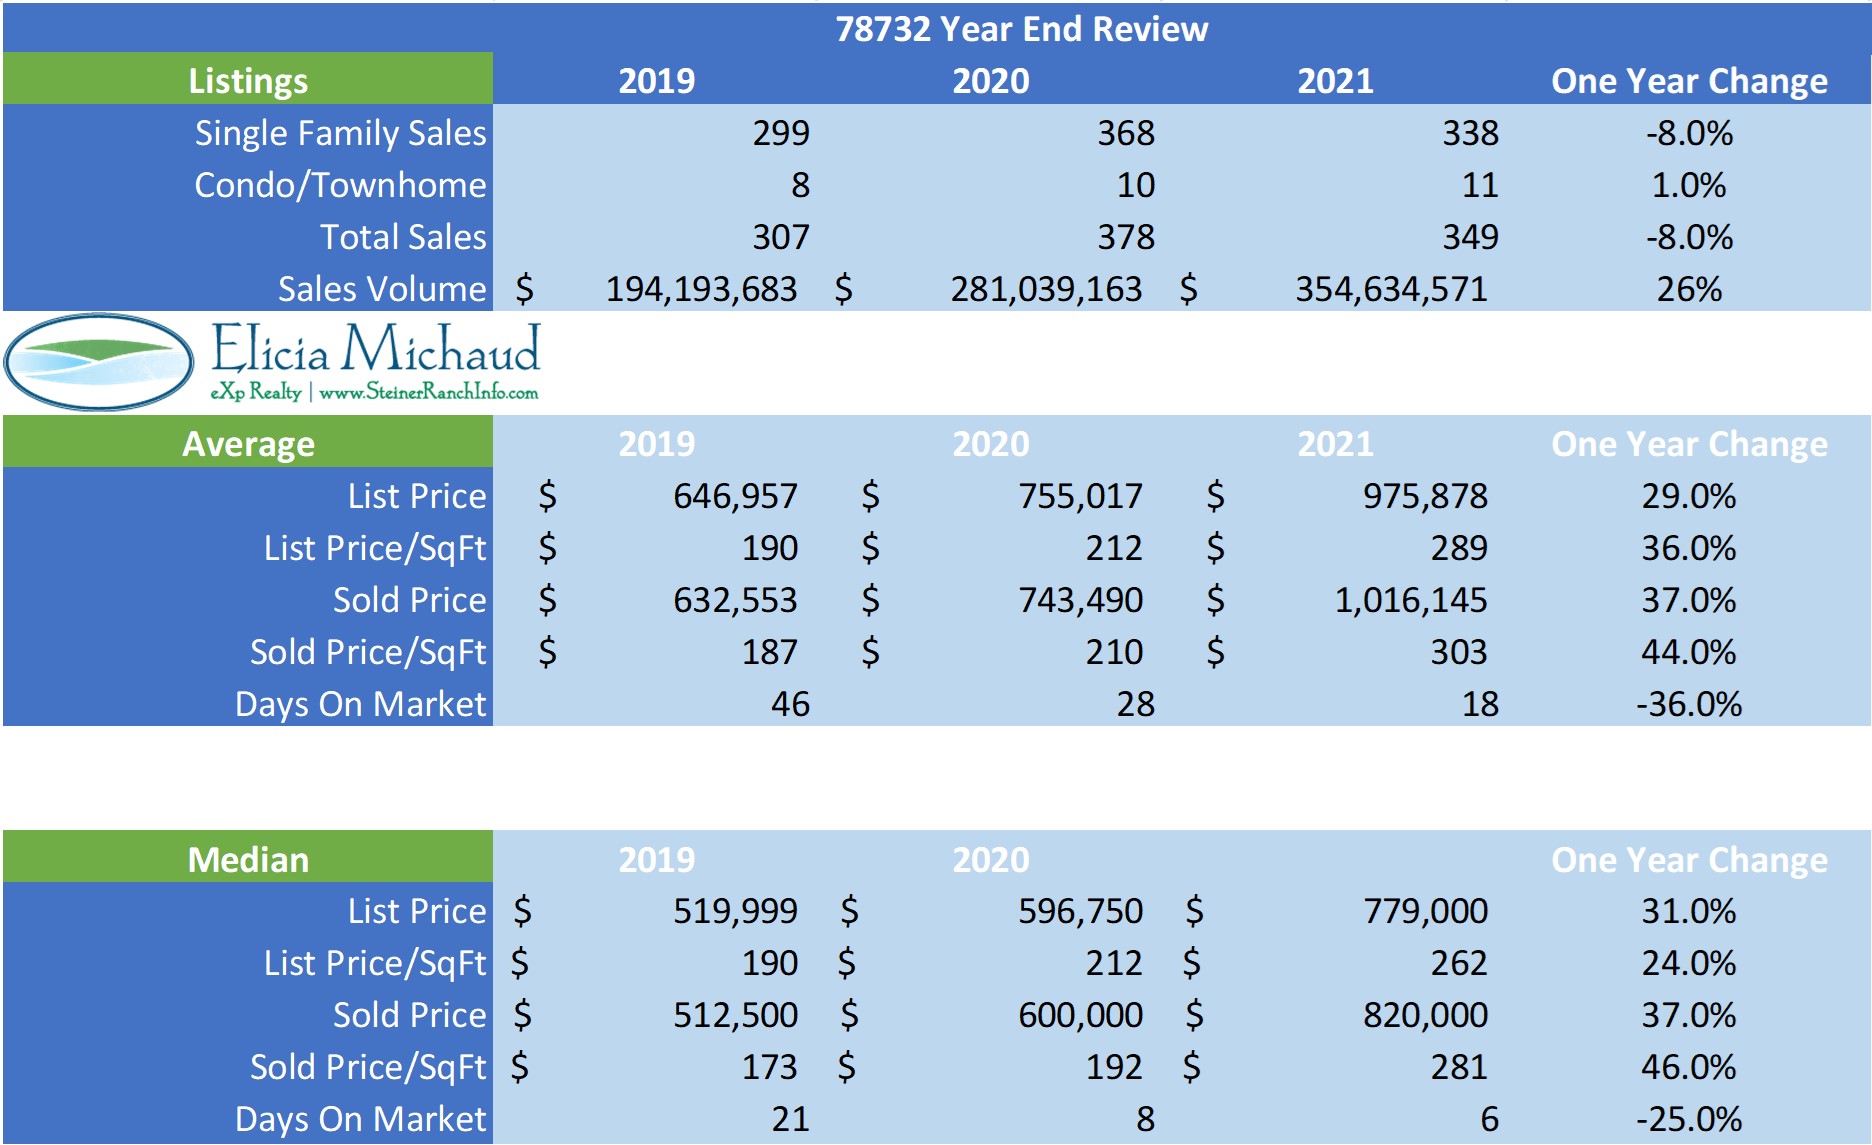
Average Price Point
This one blew me away and had me double and triple checking my math. The average sales price in 78732 in 2021 was $1,016,145! That represents a 37% increase over 2020, and a 61% increase over 2019. In 2019, properties selling under $500,000 represented 49% of the market, while those over $1,000,000 represented only 8%. In contrast, only 3% of the properties sold in 2021 were under $500,000 while the number that sold over $1,000,000 jumped to 34%!
Sales Price to List Price Ratio
Based on the number of lowball offers I received in the fall (more about that later…), I would say this is a metric widely misunderstood by both the public and my fellow real estate agents. This year, we saw ratios as high as 113% in March and April to 97% in November, and back up to 101% in December. This was due to people misjudging the strength of the market early on and under pricing the properties (or pricing lower on purpose to receive multiples), not due to fluctuations in values. Throughout the year, list prices were higher, which lowered the ratios.
Cash Buyers
We continue to see a good amount of cash buyers purchasing in 78732. These are usually buyers from out of state or investors, so while it’s not a perfect metric, it’s a good way for me to keep an eye on the type of buyers in the market. This helps to know how to market my listings as well as how to counsel buyers on structuring their offer to stay competitive. Eight months this year had 20% or more cash buyers, with February and August being the highest at 35% and 36% respectively.
Zillow and Open Door
For a couple months this year, Zillow and Open Door were on a spending spree in Steiner Ranch. I know of a couple homes they overpaid for by over $100,000! An algorithm is never going to be able to properly price a home because they can’t account for things like bad floorplans, shoddy upgrades, deferred maintenance, etc… That’s a whole other conversation though so back to how that’s affecting our market in 78732. We reached a point in late summer when these iBuyers owned a majority of the active inventory. On November 18, 7 of the 8 listings in Steiner Ranch (under a million) were owned by Open Door, and today, January 5, every single listing available in Steiner Ranch is owned by Open Door! They all have issues and they are all overpriced, and because of this, they have been on the market for 70, 77, 87, and 170 days! Refer back to the beginning of this analysis where I mentioned the lowball offers I got in the fall – they all referenced the “abundance of inventory sitting on the market” because they lacked the understanding of our market or simply didn’t take a deep dive into what was actually sitting on the market and why. Fortunately Zillow has ended their program and hopefully Open Door will do the same or at least do a better job in 2022 so that we don’t have these outliers affecting our numbers.
Expectations for 2022 – Will prices keep going up?
Yes, I believe they will. How much? It depends on who you believe. “Experts” say anywhere from 3% (3-6% annually is considered “normal”) to 13%. Those who believe it’s on the lower end cite decreased affordability while those who believe it will be higher think inflation and an increase in higher paying tech jobs will play a factor. Personally, I haven’t seen any decrease at all in the number of calls I’m getting or web traffic. I’m still seeing the vast majority of my out-of state calls and web searches coming from California. And keep in mind that 6 months of inventory is considered a balanced market. The average “months of inventory” we’ve had in 78732 for the past 12 months is .78 months.
Rental Market
Along with rising sales prices, we saw rental prices climb. Many rental property owners chose to sell this year, lowering the number of available homes to rent. In addition, many tenants who were planning to buy were unable so those properties never came on the market this year. 27 fewer properties leased in 78732 in 2021 vs. 2020 and they leased in half the time (15 days in 2021 vs. 30 days in 2020) for an average of 16% more.
Thank YOU!
Lastly, 2021 was an amazing year for me in Real Estate and am extremely grateful to not only my current and past clients, but also to those of you who trust me as a Steiner Ranch expert and refer your friends and families to me. I proud to say that I closed my 282nd Steiner Ranch transaction this year and hope to help many more Steiner Ranch friends and neighbors in 2022. If you’re planning a move, or even just have a question about the market, I’m here to be of service. Don’t hesitate to call or text me at (512) 657-7510, or email me at Elicia@SteinerRanchInfo.com. Also, you can always use www.SteinerMarketInfo.com as a direct link to find all of my market statistics for both sales and rentals.
