| Metric | September 2024 | September 2025 | September 2026 |
|---|---|---|---|
| New Listings | 20 | 19 | 23 |
| Months of Inventory | 5.5 | 5.3 | 3.9 |
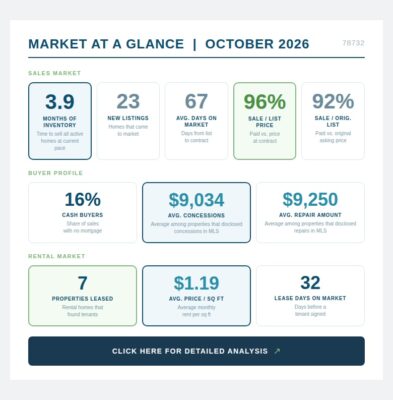
September 2026 brought 23 new listings, modestly above both September 2024 (20) and September 2025 (19), and in line with normal fall market patterns. Supply is not contracting on the listing side. What has changed is how quickly the market is absorbing available inventory.
Months of inventory came in at 3.9, the third consecutive month below 4.0. June was 3.6, July pulled back briefly to 4.3 on a surge of 46 new listings, August came in at 4.1, and September is now 3.9. That is a sustained seller's market by any standard definition, and the longest consecutive stretch below 4.0 since 2022. Both September 2024 (5.5) and September 2025 (5.3) were running more than a full month higher than today's reading.
Three consecutive months below 4.0 is no longer a single data point worth watching. It is a confirmed market condition. Steiner Ranch is in a seller's market heading into fall.
| Month | 2024 | 2025 | 2026 |
|---|---|---|---|
| June | 4.3 | 6.7 | 3.6 |
| July | 4.6 | 5.2 | 4.3 |
| August | 4.7 | 5.1 | 4.1 |
| September | 5.5 | 5.3 | 3.9 |
In each of the four most recent months, 2026 inventory ran well below both prior years. September's 3.9 is the lowest September reading since at least 2022.
| Metric | September 2024 | September 2025 | September 2026 |
|---|---|---|---|
| Sale / Current List Price | 95% | 96% | 96% |
| Sale / Original List Price | 88% | 92% | 92% |
The current-list ratio held at 96% in September, matching September 2025 and above September 2024's 95%. Fall months historically produce slightly softer ratios than spring, so holding at 96% against a backdrop of tightening inventory is a solid result.
The original-list ratio at 92% matches September 2025 exactly and is significantly better than September 2024's 88%. On a $900,000 home, the difference between 88% (2024) and 92% (2026) is $36,000. Sellers today are leaving less on the table than they were two years ago. That said, the 4-point gap between the two ratios tells a familiar story: homes that require a price reduction before going under contract are still paying a meaningful penalty.
There is also a notable tension worth naming directly. Inventory is at its tightest since 2022, yet the original-list ratio at 92% has not improved from last September. The expected result of sustained sub-4.0 inventory is upward pressure on pricing ratios. That has not materialized yet. The sales DOM figure addressed in the Recap explains why.
| Metric | August 2026 | September 2026 |
|---|---|---|
| Avg. Seller Concessions | $9,275 | $9,034 |
| Avg. Repair Credits | $8,380 | $9,250 |
Seller concessions averaged $9,034 in September, a modest step down from August's $9,275. Repair credits averaged $9,250, slightly above August's $8,380. Both figures remain in a consistent range and confirm that negotiations over condition and cost contributions are a routine part of the current market.
These are averages among listings where the selling agent reported concessions or repairs in MLS. Many transactions go unreported, so these figures reflect a subset of closed sales rather than the full market. Concessions can represent closing cost assistance, rate buy-downs, or credits given in lieu of repairs. Sellers should be aware that buyers today are placing increased scrutiny on roof age, HVAC condition, and water heater life expectancy. Homes in excellent mechanical condition tend to face fewer repair requests and can negotiate from a stronger position at the table.
| Metric | September 2024 | September 2025 | September 2026 |
|---|---|---|---|
| Cash Transactions | 20% | 25% | 16% |
Cash transactions came in at 16% in September, below both September 2024 (20%) and September 2025 (25%). This is the fifth of the last six months at or below 20%, and the pattern is now consistent enough to treat as structural rather than month-to-month noise. The Steiner Ranch buyer pool has shifted. Cash remains a factor, but it is no longer the dominant force it was in 2024 and 2025.
The six-month average from April through September 2026 sits at approximately 19%. That is the most reliable read on the current market. Cash offers still carry real advantages in certainty and speed, but a well-constructed financed offer can be genuinely competitive in this environment. Sellers should calibrate their offer evaluation strategy accordingly.
| Metric | September 2024 | September 2025 | September 2026 |
|---|---|---|---|
| Properties Leased | 8 | 6 | 7 |
| Avg. Price per SF | $1.15 | $1.38 | $1.19 |
| Avg. Days on Market | 8 days | 35 days | 32 days |
September's rental figures require honest context. At $1.19 per square foot, the average rate dropped sharply from August's $1.53 and came in below September 2025's $1.38. Before drawing conclusions from that figure, sample size matters. With only 7 properties leased, a single large home or an outlier transaction can move the monthly average by several cents per foot. September is historically the slowest leasing month of the year in Steiner Ranch (September 2024 had 8, September 2025 had just 6), so the transaction pool is inherently thin.
Days on market at 32 days nearly matches September 2025's 35 days and is well above September 2024's unusually fast 8-day pace. The rental market is not absorbing properties instantly, but 32 days is not a sign of distress. It is consistent with tenants taking time to make decisions at current price points.
The 2026 monthly rental $/SF readings through September have been: $1.31 (Jan), $1.72 (Feb), $1.39 (Mar), $1.60 (Apr), $1.34 (May), $1.35 (Jun), $1.40 (Jul), $1.53 (Aug), $1.19 (Sep). The swing from $1.53 to $1.19 in one month reflects small-sample volatility more than a directional shift. September 2024 was also $1.15, confirming that September is consistently the softest leasing month of the year in this market. The 2026 range of $1.19 to $1.72 has a midpoint closer to $1.35 to $1.45 when outlier months are excluded. October's data will tell us far more about where rental rates are actually heading into winter.
September 2026 has a clear headline and an interesting contradiction worth unpacking.
The headline: 3.9 months of inventory marks the third consecutive month below 4.0, confirming that Steiner Ranch has entered a sustained seller's market for the first time since 2022. September 2024 was 5.5 months and September 2025 was 5.3. The market has tightened by more than a full month year over year.
The contradiction: with inventory this tight, sales DOM of 67 days is the highest September figure in three years (September 2025 was 48, September 2024 was 64). Homes are taking longer to sell even as fewer are available. The explanation is straightforward. Correctly priced homes are getting offers. Overpriced homes are accumulating days on market, requiring reductions, and then closing at a discount to original list. The original-list ratio at 92%, unchanged from last September despite far tighter inventory, confirms this dynamic. The market is tight, but it is not forgiving overpricing.
Cash at 16% extended its declining trend, with a six-month average near 19% now reliable enough to call structural. The buyer pool has repositioned. Financed buyers are the market now.
The rental market showed a sharp single-month dip to $1.19/SF on just 7 leases. September is historically the slowest leasing month of the year, and small sample sizes create real volatility. The range this market has established across 2026 suggests a sustainable midpoint in the $1.35 to $1.45 range for well-priced properties. October will provide a cleaner read.
- Will inventory hold below 4.0 in October? Three consecutive months below 4.0 is now a confirmed trend. October historically sees a further seasonal drop in listing activity before the year-end slowdown. October 2025 brought 28 new listings and October 2024 brought 19. If that pattern holds, a fourth consecutive month below 4.0 would be the strongest sustained seller's market signal this dataset has produced since 2022.
- Will the original-list ratio respond to tighter inventory? This is the central question heading into fall. Four months of sub-4.0 inventory and the ratio is still at 92%, unchanged from a year ago. The DOM data suggests overpricing is the culprit. If sellers begin pricing to today's market rather than aspirationally, the ratio should improve. If they don't, DOM will keep climbing regardless of how tight inventory gets.
- Sales DOM at 67 days is worth tracking. September 2024 was 64 days and September 2025 was 48 days. At 67 days, this September is the highest in three years. That is not a market-condition story. It is a pricing story. Correctly priced homes are moving; overpriced homes are dragging the average up. Whether October's DOM improves or continues climbing will tell us whether sellers are adjusting.
- Is 16% cash the new floor? Five of the last six months have come in at or below 20%, with the last two at 16% and 16.6%. If October comes in again below 20%, the case for calling this a financed-buyer-dominant market becomes very strong, and listing strategy and offer evaluation should reflect that reality.
- Rental $/SF recovery in October. October 2025 was $1.21 and October 2024 was $1.24. If October 2026 comes in at or above those figures, September's $1.19 was seasonal noise. If it stays near $1.19 or lower, a genuine softening of fall rental rates is underway, and landlords should price accordingly heading into the slow winter leasing season.
View all Historical Data Here in Original Chart Form
If you’re considering buying or selling a property in Steiner Ranch, it’s crucial to work with an experienced professional who understand the nuances of the local market. For any questions about Steiner Ranch or real estate in general, feel free to reach out at (512) 657-7510 or email me at Elicia@SteinerRanchinfo.com