1. Inventory
| Metric | August 2024 | August 2025 | August 2026 |
|---|---|---|---|
| New Listings | 22 | 19 | 21 |
| Months of Inventory | 4.7 | 5.1 | 4.1 |
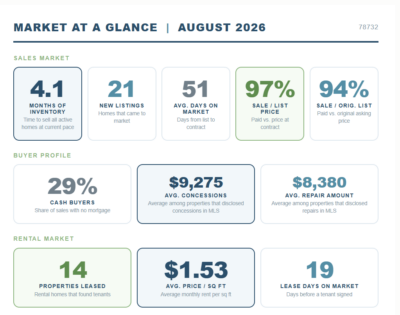
After July's record 46 new listings, the market returned to normal seasonal patterns in August. With 21 new listings, supply came in right between August 2024's 22 and August 2025's 19. The listing surge that surprised in July was a one-month event. The seasonal compression that typically characterizes late summer arrived one month delayed but arrived nonetheless.
Months of inventory continued its 2026 tightening arc, landing at 4.1, the lowest August reading since 2022, and the third consecutive month below 4.5. For context: August 2024 was 4.7 and August 2025 was 5.1. The market is running a full month tighter than last August and more than half a month tighter than the year before.
The pattern across June, July, and August now tells a clear story. Inventory has held in the 3.6 to 4.3 range for three consecutive months despite a record-high listing month in July. Buyer demand in Steiner Ranch has been consistently strong enough to keep inventory below 4.5 through what is typically the softest stretch of the year. That is a meaningfully different market than the one that opened 2026 at 6.7 months.
| Month | 2024 | 2025 | 2026 |
|---|---|---|---|
| June | 4.3 | 6.7 | 3.6 |
| July | 4.6 | 5.2 | 4.3 |
| August | 4.7 | 5.1 | 4.1 |
In each of the three summer months, 2026 inventory ran below both prior years. That consistency across a period that included a record-high listing month in July is a strong signal of underlying demand.
2. Pricing Ratios
| Metric | August 2024 | August 2025 | August 2026 |
|---|---|---|---|
| Sale / Current List Price | 97% | 99% | 97% |
| Sale / Original List Price | 90% | 95% | 94% |
The current-list ratio returned to 97% in August after July's notable 97.5% reading. The broader picture remains: outside of 2021 and July's single-month reading, this ratio stays at 97%. Sellers who are at their current listed price when a buyer arrives capture 97 cents on the dollar, consistently.
The original-list ratio at 94% is the more encouraging number this month. August 2024 came in at 90% and August 2025 at 95%, making 2026's 94% a significant improvement over two years ago. Three months of original-list ratios now read: June 94%, July 92.6%, August 94%. The ratio is holding in the 93 to 94% zone rather than the 90 to 92% range that characterized much of 2024.
The original-list ratio is the most honest measure of whether overpricing is being punished less severely. At 94%, August 2026 is 4 points better than August 2024's 90%. In dollar terms on an $850,000 home, that is the difference between netting $765,000 (90%) and $799,000 (94%), a $34,000 improvement. The market is not yet rewarding sellers who overprice, but it is penalizing them less than it did two years ago.
3. Seller Concessions and Repairs
| Metric | August 2026 |
|---|---|
| Avg. Seller Concessions (where disclosed) | $9,275 |
| Avg. Repair Amount (where disclosed) | $8,380 |
An important note on data integrity before interpreting these numbers: not all agents are diligent about reporting concessions and repair amounts accurately in the MLS after closing. These figures represent averages only among the transactions where the listing agent did report them. They are meaningful directional data, but they are not averages across every sold property in Steiner Ranch this month.
With that context, the numbers tell a clear story. Sellers in August were averaging $9,275 in concessions and $8,380 in repairs on the transactions where these were disclosed. Combined, they represent roughly $17,000 in seller-side costs beyond the agreed sale price on a meaningful share of closings.
It is also worth understanding what these categories represent. Concessions and repairs are sometimes used interchangeably in negotiations. A seller may opt to give a cash concession rather than complete repairs, allowing the buyer to manage the work themselves after closing. Concessions may also be structured as closing cost assistance or as a rate buy-down. These are distinct uses but show up in the same category in MLS reporting.
These numbers are consistent with a broader shift in buyer expectations that has been building over the past year. Buyers are more focused than ever on the age and condition of major systems: roofs, HVAC units, water heaters, and structural components. They are not just asking about them in passing. They are using inspection results to negotiate, and they expect properties to be in excellent condition before they will commit at full price without concessions.
The practical implication for sellers is straightforward. A home that goes to market with known deferred maintenance on major systems will almost certainly produce inspection-based negotiation, repair requests, or concession demands. Addressing those items proactively before listing, pricing to reflect them accurately, or being prepared to absorb them at closing is not optional in the current environment. It is the cost of doing business in this market.
4. Cash Transactions
| Metric | August 2024 | August 2025 | August 2026 |
|---|---|---|---|
| Cash Transactions | 19% | 42% | 29% |
Cash transactions jumped to 29% in August after July's 16.6%, which on the surface looks like a reversal of the declining trend. Viewed in prior-year context, it reads differently. August 2025 was 42% and August 2024 was 19%, making 2026's 29% exactly between both prior Augusts. The swing is entirely consistent with how volatile this metric has been throughout the dataset.
The more informative view is the rolling picture. From April through August 2026, the five-month average cash share is approximately 21%. That is a meaningful step down from the 25 to 42% range that characterized high months in 2024 and 2025. The trend line across five months points to a buyer pool where cash is a significant but no longer dominant factor.
5. Rental Market
| Metric | August 2024 | August 2025 | August 2026 |
|---|---|---|---|
| Properties Leased | 10 | 14 | 14 |
| Avg. Price per SF | $1.35 | $1.22 | $1.53 |
| Avg. Days on Market | 10 days | 35 days | 19 days |
The rental market delivered a standout month. At $1.53 per square foot, August 2026 is the highest August $/SF in the dataset, well above both August 2024's $1.35 and August 2025's $1.22. After a stretch of readings that raised questions about whether rental rates were softening, August answers those questions clearly: the Steiner Ranch rental market has pricing power.
Fourteen properties leased, matching August 2025 exactly and well above August 2024's 10. Volume has been consistently strong all summer, ranging from 13 to 16 leases per month from May through August. That kind of sustained leasing activity through the traditionally slower late-summer period is a strong endorsement of the neighborhood's appeal to renters.
Days on market came in at 19 days, sitting between August 2024's unusually fast 10 days and August 2025's slow 35 days. Properties priced at current market rates are finding tenants in under three weeks. The tenant pool is active and consistent; pricing is the variable that determines how quickly a property leases.
Three months of below-prior-year $/SF (May, June) suggested softening. July's $1.40 above both prior Julys complicated that picture. August's $1.53 above both prior Augusts by a significant margin resolves it. The rental rate story in Steiner Ranch is not a declining one. It is an oscillating one, with a range that now appears to sit between $1.34 and $1.53, well above where this market traded in 2023 and 2024. Landlords who price within that range are leasing in 19 to 21 days.
6. Recap
August 2026 is a month of confirmation. Inventory held at 4.1 months, the third consecutive month in the 3.6 to 4.3 range. New listings normalized to 21 after July's record 46, and the market absorbed that normalization without any meaningful change in the inventory trajectory. Three consecutive summer months below 4.5 months of inventory, each running below both prior-year comparables, is a confirmed trend.
The pricing ratios told a steady story. The current-list ratio returned to 97% after last month's 97.5% reading. The original-list ratio at 94% is a genuine improvement over August 2024's 90%, holding the same level as June. Sellers are getting closer to their original asking prices than they were a year or two ago.
The concessions and repair data added meaningful texture this month. Sellers averaged $9,275 in concessions and $8,380 in repairs on the transactions where these were disclosed, underscoring a clear shift in buyer expectations. Today's buyers are scrutinizing major systems more than ever and expect properties to be in excellent condition. Sellers who address this proactively before listing will spend less time on market and lose less at the negotiating table.
Cash at 29% looks elevated against July's 16.6%, but against August 2025's 42% it is actually the lowest non-June August in recent memory. The five-month average near 21% remains the most reliable read. The structural shift toward financed buyers is intact.
The rental market had its strongest $/SF month since February's $1.72 peak. At $1.53, August confirms that Steiner Ranch rental rates have not structurally softened. They have established a range. Fourteen leases in 19 days at $1.53/SF is a market delivering strong results for landlords who are pricing to current data.
7. What to Watch
- Will inventory drop below 4.0 again in September? At 4.1, the market is one good month away from re-entering seller's market territory. September historically sees a modest uptick in listing activity as the fall market opens (September 2025: 19, September 2024: 20). If that pattern holds and buyer demand stays strong, inventory could push below 4.0 for the second time this year.
- Can the original-list ratio break above 94% consistently? Three months at 92.6%, 94%, 94% is a stable band. A move toward 95% or higher would signal that tighter inventory is genuinely translating into less seller concession at the negotiating table.
- Will concessions and repair amounts begin to decline as inventory tightens? These figures are a lagging indicator of buyer leverage. If inventory continues holding below 4.5 months and seller leverage returns, the average concession and repair amounts should begin compressing. Watching these numbers month over month will tell us whether the shift in buyer power is real or still one-sided.
- Cash in September: confirming the new baseline. Five months averaging 21% makes a reasonable case that the buyer pool has structurally repositioned. September will either reinforce that baseline or introduce another volatile outlier. The multi-month average is the number to anchor expectations around.
- Will rental $/SF hold above $1.40 into fall? September 2025 was $1.38 and September 2024 was $1.15. If September 2026 comes in above $1.40, it marks four of the last five months at or above that level, confirming the $1.34 to $1.53 range as the new normal for Steiner Ranch rental pricing.
- The fall selling season setup. September marks the start of the fall window, which historically brings a modest rebound in listing activity before the late-year slowdown. How sellers respond to a tighter market, with more aggressive or more accurate pricing, will determine whether the improved original-list ratio continues its upward drift or stalls. The market has given sellers more leverage than they have had in two years.
View all Historical Data Here in Original Chart Form
If you’re considering buying or selling a property in Steiner Ranch, it’s crucial to work with an experienced professional who understand the nuances of the local market. For any questions about Steiner Ranch or real estate in general, feel free to reach out at (512) 657-7510 or email me at Elicia@SteinerRanchinfo.com