Inventory – Number of Sales
Last year, I wrote about how the perception of “low inventory” changes based on demand. That definitely rang true in 2022, as inventory levels remained about the same, but this time demand dipped. 378 properties were listed in 2021 vs. 342 properties in 2022, however 350 properties SOLD in 2021 vs. only 227 SOLD in 2022. So a 9.5% drop in number of listings, but a 35% reduction in sales.
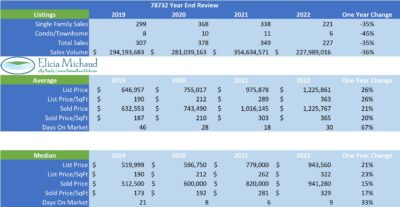
Average Price Point
We ALMOST got rid of the under $500,000 price point this year. Sales under $500,000 accounted for only .5%, down from 3.2% in 2021 and 28.8% in 2020. The number of homes over a million represented a whopping 44% of our sales, up from 35% in 2021 and 13% in 2020. The average sold price in 78732 went up 93.78% from 2019 to 2022!
List Price to Sales Price Ratio
You may have heard – the market came down a little this year. This metric got a little “fuzzy” this year for two reasons. The first reason is that in the beginning of the shift, agents weren’t adjusting prices, they were listing above even the top of the market prices of early spring 2022 and were way too slow to read the market and had to do major reductions. If you follow my reports, I mostly track the ORIGINAL list price to sales price ratio, meaning the sold price to the price it originally came on the market at (as opposed to the reduced price that it went pending at). In 2021, these numbers ranged from a low of 96% to a high of 113%. In 2022, that range fell to 88% to 107%. Full disclosure though – in December, the iBuyer numbers (Redfin, OpenDoor) were so crazy low, I felt it necessary to remove those few sales so they didn’t give a less an accurate picture of the market as a whole.
iBuyers
This brings me to the second reason these numbers dropped – iBuyers! Take a look at what I wrote about them in last year’s market report here. OpenDoor hasn’t gone out of business yet but they did finally stop WAY overpaying for homes late this year. They overpaid on some home by over $100,000 which meant they put them back on the market at hyperinflated prices, which then required massive reductions in order to sell. Some notable ones were 12505 Mulberry Creek – listed for $960,000, sold for $700,000 and 2601 Golden Gate Park – listed originally for $783,000, sold for $563,100 – both by OpenDoor.
CURRENT List Price to Sales Price Ratio
Because of what I described above, I decided to start publishing the CLP/SP Ratios – current list price means the price the property was listed at when it went pending, so the final reduced price – if there were reductions. This hadn’t been that interesting in the past few years because there were very few reductions. But what I kept hearing this year was “why reduce, everyone wants to lowball anyways?” This has never been true and it was still not true this year. A properly priced home will always sell (with the caveat that it’s marketed properly, and there are no mistakes in the listing/marketing which sadly I see all the time!). When you look at the CLP/SP ratio, there is much less volatility. The lowest number we saw here all year was 96%.
Cash Buyers
We continued to see a lot of cash buyers this year. Typically these are out of state buyer or investors, but this year I saw a lot of people downsizing and using their proceeds to buy with cash. Nine months of 2022 saw more than 20% cash buyers.
Expectations for 2023 – Where are we headed?
Personally, I’ve seen a major shift in buyer’s attitudes in the last 60 days. I think people expecting a crash are going to be disappointed. We continue to have very low inventory and there are a lot of buyers who still want to move who couldn’t in the ultra competitive markets of 2021 and 2022. Just yesterday, I wrote a cash offer on a property in Steiner Ranch and there were 3 cash offers in the first 48 hours. This property was properly priced. The Days on Market for the properties closed in the last 60 days was only 42 and our “months of inventory” has been under 3 for the past 3 months. I predict this year will be similar to 2019, which was a great year!
Rental Market
As predicted, rental prices in 78732 did increase. The average $/sf was $1.47 in 2022, up 13.9% from 2021 when the average was $1.29 and 32.4% more than 2021 when the average was $1.11. Days on market increased from 15 days last year to 26 days.
Thank YOU!
Lastly, 2022 was another amazing year for me in Real Estate and am extremely grateful to not only my current and past clients, but also to those of you who trust me as a Steiner Ranch expert and refer your friends and families to me. I proud to say that I closed my 295th Steiner Ranch transaction this year and hope to help many more Steiner Ranch friends and neighbors in 2023. If you’re planning a move, or even just have a question about the market, I’m here to be of service. Don’t hesitate to call or text me at (512) 657-7510, or email me at Elicia@SteinerRanchInfo.com. Also, you can always use www.SteinerMarketInfo.com as a direct link to find all of my market statistics for both sales and rentals.
